Over the past two weeks the price of money changed direction.
The Fed raised rates for the first time since 2023 and the 10-year Treasury yield closed at 5.29%, the highest since 2002, while Bitcoin rose 7.10% on ETF inflows. Plus: four updated scenarios to Q3 2027, and an interview with Alex Pham on how a hot wallet was drained through a third party.

00 — Editor's Letter
Over the past two weeks the price of money changed direction. On 16/09 the Fed raised interest rates for the first time since 2023: another 0.25 percentage points, taking the federal funds range to 3.75–4.00%, with 12 votes in favour and none against. Fourteen days later the 10-year US Treasury yield closed at 5.29%, the highest since May 2002.
The gap between those two numbers is what deserves thought. The Fed's ceiling is 4.00%. The two-year yield, the maturity that tracks policy most closely, is at 4.88%, which is 88 basis points above that ceiling. The market does not treat this hike as a stopping point. Section 01 draws the path of the three rates, and section 07, written by Fable, tells the story of rates at a multi-year high.
Inflation does not yet allow any easing. August CPI rose 3.40% year on year, core 2.45%; PCE, the measure the Fed aims at, rose 3.42% and core 3.01%. The two core measures differ by 0.56 points, and the Fed's measure is the higher one. Section 02 has the full table.
The 20-indicator table has 13 red cells and 7 green. The Nikkei 225 (+5.65%) and Taiwan (+3.01%) are the greenest among the indices; India (−4.50%) and the VN-Index (−4.37%) the reddest. Gold is −4.65%, silver −5.54%, Brent crude −4.94%.
Issue A03 promised to measure foreign capital flows after FTSE Russell's upgrade of Vietnam. The result: foreign investors were net sellers of VND 2,868 billion in the first week, the net-selling streak ran until at least the 30/09 session, and the VN-Index closed at 1,749.30 points, −3.41% versus issue A03. The upgrade is the ticket; the money follows each fund's own calendar.
Crypto went against most assets: Bitcoin rose 7.10% in 15 sessions to $83,838, and US Bitcoin ETFs saw net inflows in 10 of 11 sessions, $3.03 billion in total. Breadth is also different from last issue: 176 of 205 large coins rose over 14 days. Section 04 gathers the stories worth reading: the SEC's five-year innovation exemption, the CFTC not waiting for Congress, and Bitget losing $387.5 million from a hot wallet.
Three parts of this issue deserve attention. Section 05 is Fable's four new scenarios. Section 06 profiles ICP, which rose 31% in 30 days but is still 99.5% below its peak. Section 08 is an interview with Alex: the Cosmos Digital hot wallet was attacked by a hacker through a third party's contract, and supply-chain risk is the kind of risk that is hardest to see.
A note on timing: the data in this issue closes at the end of the 01/10 US session, which is the morning of 02/10 in Vietnam. The FRED broad dollar index lags by a few days, and the Fear & Greed Index is set at 00:00 UTC.
01 — Global Equities & Macro
13 red cells, 7 green. The green cells are the S&P 500, Nikkei 225, Taiwan, the broad dollar, the 10-year yield, USD/VND and crypto market capitalisation. Reading that list gives you the picture: the dollar, yields and Bitcoin went up; apart from Japan and Taiwan, nearly everything else went down. Among the indices and commodities, the biggest fall was silver (−5.54%) and the biggest rise the Nikkei 225 (+5.65%). Changes are versus 15 sessions earlier (10/09/2026); data as of 01/10/2026, broad dollar as of 25/09, crypto market cap measured by Bitcoin's change. Sources: Yahoo Finance, FRED, DNSE/VNDirect, CoinMarketCap.
The 20-Indicator Table
- S&P 500 — 7,666 · +0.98%
- Euro Stoxx 50 — 6,175 · −1.49%
- FTSE 100 — 10,428 · −1.70%
- Nikkei 225 — 68,957 · +5.65%
- Hang Seng — 24,613 · −2.62%
- Shanghai — 3,842 · −2.77%
- Kospi — 6,971 · −0.89%
- Taiwan — 48,353 · +3.01%
- Singapore — 5,668 · −0.39%
- India · Nifty 50 — 22,422 · −4.50%
- Australia · ASX 200 — 8,614 · −2.32%
- Vietnam · VN-Index — 1,749.30 · −4.37%
- Gold — $4,202 · −4.65%
- Silver — $60.73 · −5.54%
- Brent crude — $102.31 · −4.94%
- Dollar · broad basket — 120.33 · +1.91%
- 10-year yield — 5.29% · +46 bp
- VIX · fear — 16.39 · −8.13%
- USD/VND — 25,959 · +0.21%
- Crypto market capitalisation — $2.872 trillion · +7.10% (BTC)
Fed · The First Hike Since 2023
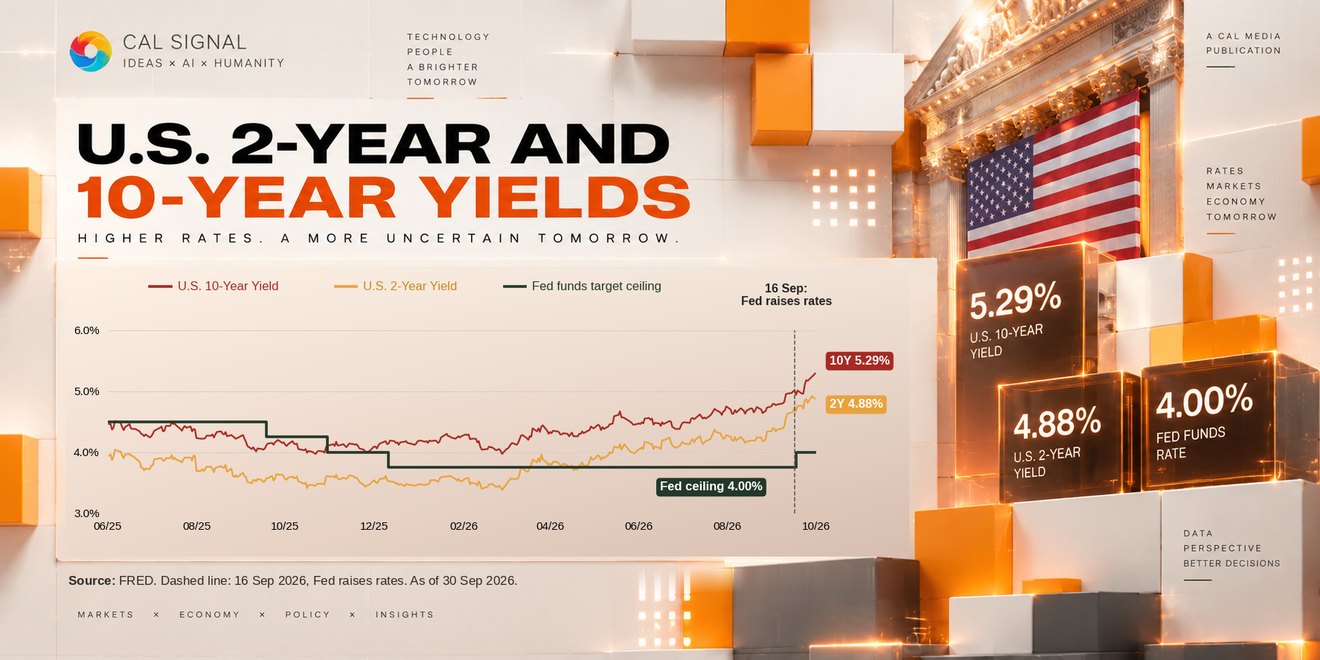
US Treasury yields against the Fed's upper bound, June 2025 to 30/09/2026: 10-year 5.29%, 2-year 4.88%, Fed upper bound 4.00%. Source: FRED.
On 16/09 the FOMC raised the federal funds target range by a quarter of a percentage point to 3.75–4.00%, by a vote of 12–0. The statement said economic activity is expanding at a solid pace, inflation remains elevated and employment is holding steady. · Fed, 16/09/2026
It is the first hike since 2023: in the FRED data, from the start of 2024 the ceiling saw only cuts, then nine months of standing still. The ceiling is now 4.00%; the effective rate on 30/09 was 3.88%.
Three numbers on the same day, 30/09/2026. The 2-year yield of 4.88% is 88 basis points above the Fed ceiling: the market does not treat this hike as a stopping point. The 10-year yield of 5.29% is the highest since 14/05/2002. The 10-year minus 2-year spread is 0.41 points, and the curve still slopes upward. · FRED DGS10
Global Equities · Japan Up, Europe Down
The S&P 500 rose 0.98% to 7,666 points (as of 01/10), a slight gain. The Euro Stoxx 50 fell 1.49% and the FTSE 100 1.70%. The Nikkei 225 is the bright spot: +5.65% to 68,957 points. The VIX is at 16.39 (−8.13%), a normal range. There is no sign of panic; just a market accepting a higher price of money.
Asia · The Damage Is in Emerging Markets
Taiwan, up 3.01% (centred on semiconductors), is the second green cell. In contrast India (Nifty 50) fell 4.50%, Australia 2.32%, Shanghai 2.77%, Hang Seng 2.62%, Kospi 0.89% and Singapore 0.39%. High US yields pull money away from markets that live on foreign inflows; where there are real orders, as in semiconductors, the money stays.
Vietnam · An Upgrade Is Not a Capital Flow
Issue A03 promised to measure foreign capital flows after FTSE Russell's upgrade of Vietnam (21/09). The result ran against expectations. In the first week (21–25/09), foreign investors were net sellers of VND 2,868.2 billion on HOSE; the VN-Index fell 30.55 points (−1.68%) to 1,785.11. · SGGP
The net-selling streak did not stop. On 30/09 it was the sixth session in a row, VND 653 billion, concentrated in TCB, VIC and PNJ · Vietstock. On 01/10 foreign investors sold a further VND 78.69 billion net; the VN-Index closed at 1,749.30 points, −3.41% versus the 1,811.15 points of issue A03. · Nhà báo & Công luận
Why? According to Mr Đinh Quang Hinh (VNDirect), in the first tranche Vietnamese stocks account for only about 10% of the FTSE index, equivalent to roughly $220 million of passive money, and that was already deployed before the effective date. The other roughly 90%, around $2 billion, comes through three tranches in 2027. The upgrade is the ticket; money moves on each fund's calendar. · VTV. Different outlets count over different scopes (HOSE or the whole market), so absolute figures may differ.
USD/VND is at 25,959 (+0.21%): the dong has barely moved.
Gold · Silver · Oil · The Causal Chain Has Changed
Gold fell 4.65% to $4,202, silver 5.54% to $60.73 and Brent crude 4.94% to $102.31. In issue A03, oil rose and pulled inflation up, and rates rose following oil. This issue oil fell 5% and the 10-year yield still rose another 46 basis points: the rates story no longer starts from the oil price; it can stand on its own. Precious metals, which pay holders no interest, continued to be sold as real rates rose.
The broad dollar is at 120.33 (25/09, FRED lags by a few days), +1.91% versus the 04/09 reading.
02 — World Finance (Macro)
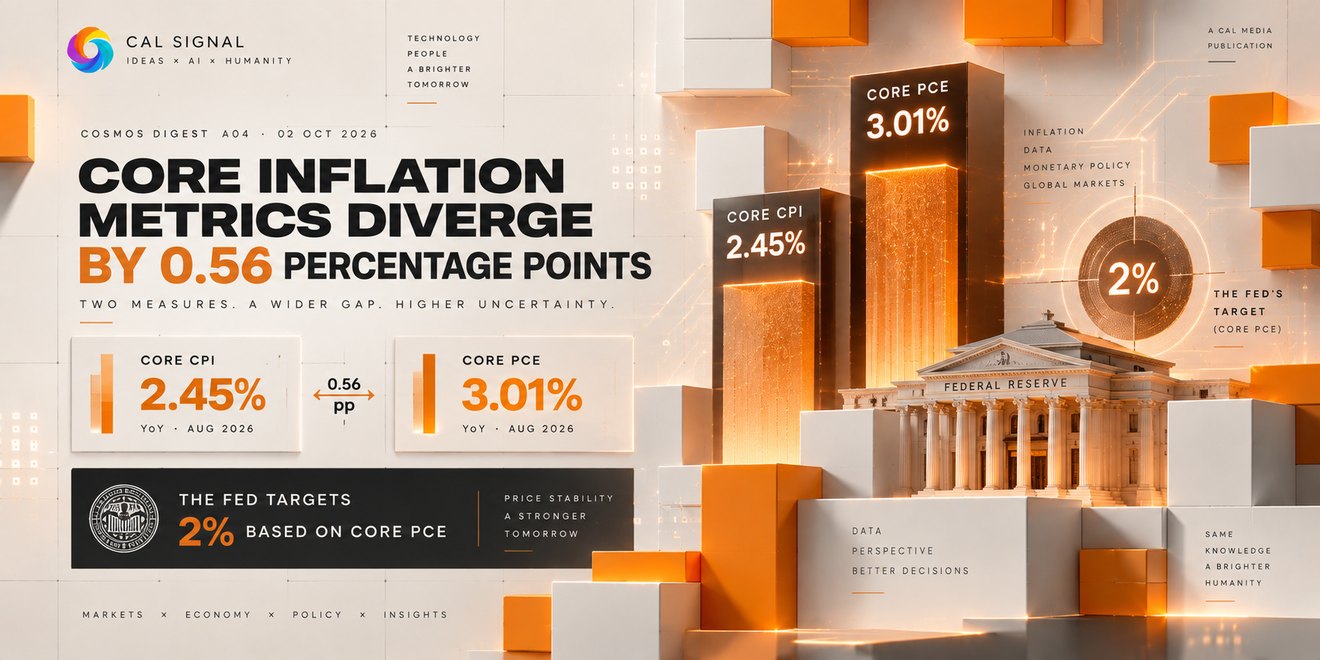
America's two inflation gauges have just given two different answers on core prices: core CPI is only 2.45%, but core PCE, the measure the Fed takes as its 2% target, is at 3.01%.
US Inflation, August · CPI and PCE
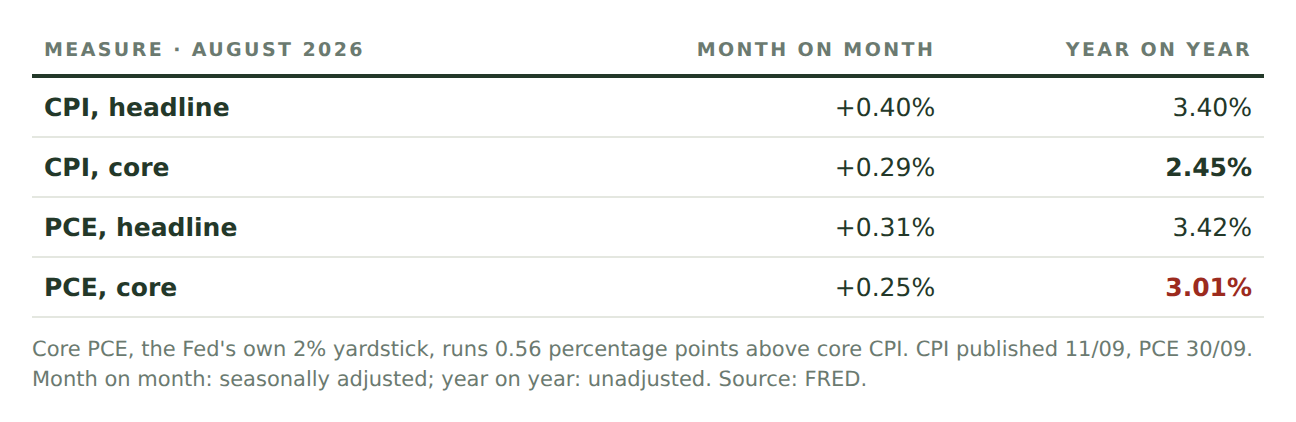
US inflation, August 2026: CPI and PCE, headline and core, month on month and year on year. Core CPI 2.45% against core PCE 3.01%, a gap of 0.56 percentage points. Source: FRED.
The gap between the two core measures is 0.56 points, and it sits on the unfavourable side: the measure the Fed targets is higher than the one households read every day. One way to read it: the Fed looks at PCE, not CPI, so it can raise rates even while core CPI is cooling. CPI was published on 11/09, PCE on 30/09. Month on month: seasonally adjusted series; year on year: unadjusted series.
Rates Box
- Fed upper bound — 4.00% · 01/10 · +25 bp since 16/09
- 2-year yield — 4.88% · 30/09 · +45 bp in 15 sessions
- 10-year yield — 5.29% · 30/09 · +46 bp in 15 sessions
- 30-year yield — 5.64% · 30/09 · +36 bp in 15 sessions
- 10-year minus 2-year — 0.41 points · 30/09 · 5.29 − 4.88
- Dollar · broad basket — 120.33 · 25/09 · +1.91% in 15 sessions
Macro Indicator Table
- Fed balance sheet — $6.743 trillion · +0.09% over 4 weeks · 30/09
- US Treasury balance at the Fed (TGA) — $948.7 billion · +8.2% over 2 weeks · 30/09
- Overnight reverse repo — $0.35 billion · almost drained · 01/10
- M2 money supply — $23.343 trillion · +5.66% a year · 08/2026
- Brent crude — $102.31 · −4.94% over 15 sessions · 01/10
- Gold — $4,202 · −4.65% over 15 sessions · 01/10
Reverse repo jumped in the last two sessions of the quarter (29–30/09), which is typical at quarter-end. · FRED · Yahoo Finance
BoJ · Overnight Rate Around 1.25%
On 18/09 the Bank of Japan raised its uncollateralised overnight rate to around 1.25% (from about 1.0%), by a vote of 7–2, effective 24/09. Two major central banks raised rates in the same week; the Nikkei is still the strongest green cell in the 20-indicator table. · BoJ
S&P Global to Buy OpenZeppelin
On 17/09 S&P Global agreed to acquire OpenZeppelin, the widely used smart-contract auditor and open-source contract library; the company says its library has moved more than $37 trillion in value and it has carried out more than 900 assessments. The price was not disclosed; the deal has not closed. · S&P Global
MoonPay · A Route into On-Chain Capital Markets
On 17/09 MoonPay and WisdomTree announced a collaboration to give eligible US investors access to WTGXX, a tokenised Treasury-bill money market fund. On 23/09 MoonPay signed an agreement to buy North Capital (which has an SEC-registered broker-dealer and the PPEX system with more than 1,250 approved assets); the deal awaits approval and the release did not state a price. · WisdomTree · MoonPay
Binance · Circle
Binance bought $100 million of Circle shares and re-signed a five-year USDC agreement; Circle pays monthly rewards based on wallet balances. · WSJ
03 — Crypto Market Overview
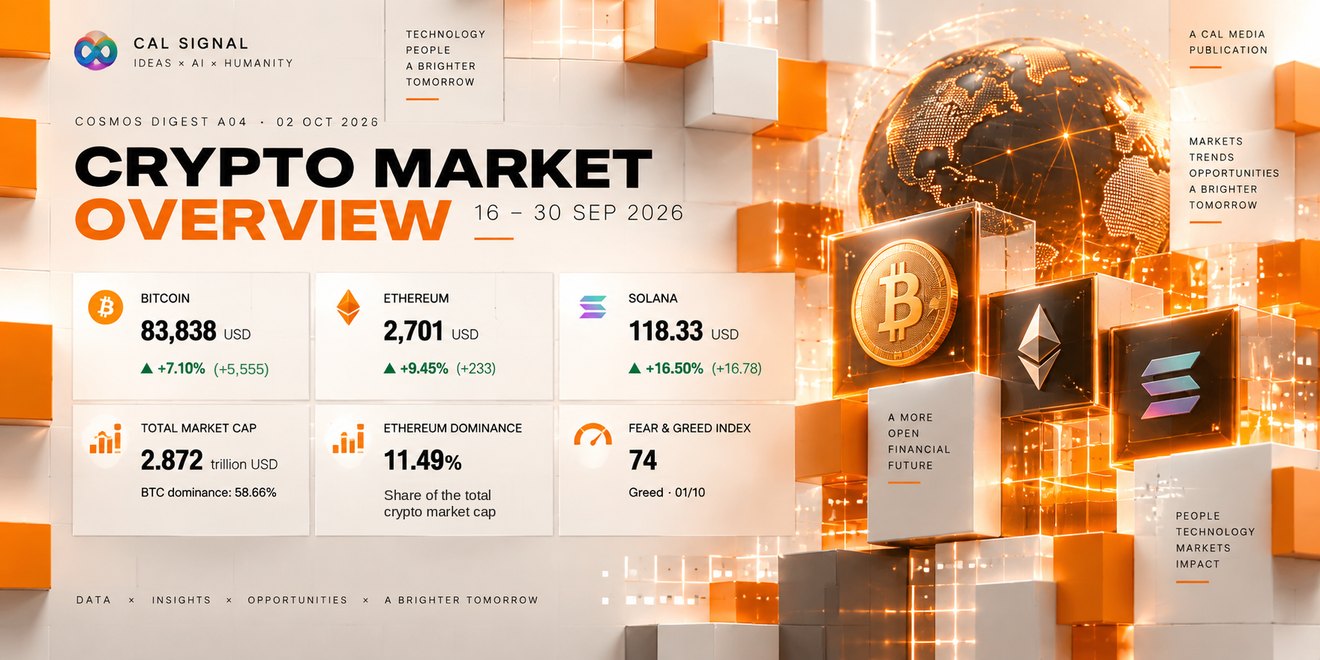
Crypto overview, 16–30/09/2026: Bitcoin $83,838 (+7.10%), Ethereum $2,701 (+9.45%), Solana $118.33 (+16.50%), total market capitalisation $2.872 trillion, Bitcoin's share 58.66%, Ethereum's 11.49%, Fear & Greed Index 74. Changes are versus 15 sessions earlier (10/09). Sources: CoinGecko, CoinMarketCap, Alternative.me, as of 01/10/2026.
Over the last fifteen sessions Bitcoin rose 7.10%, Ethereum 9.45% and Solana 16.50%. Bitcoin was stronger than every equity index in the 20-indicator table. Last issue all three were red while yields rose; this issue yields kept rising and crypto reversed. Zoom out to twelve months, though, and the picture is very different.
Bitcoin · Twelve Months
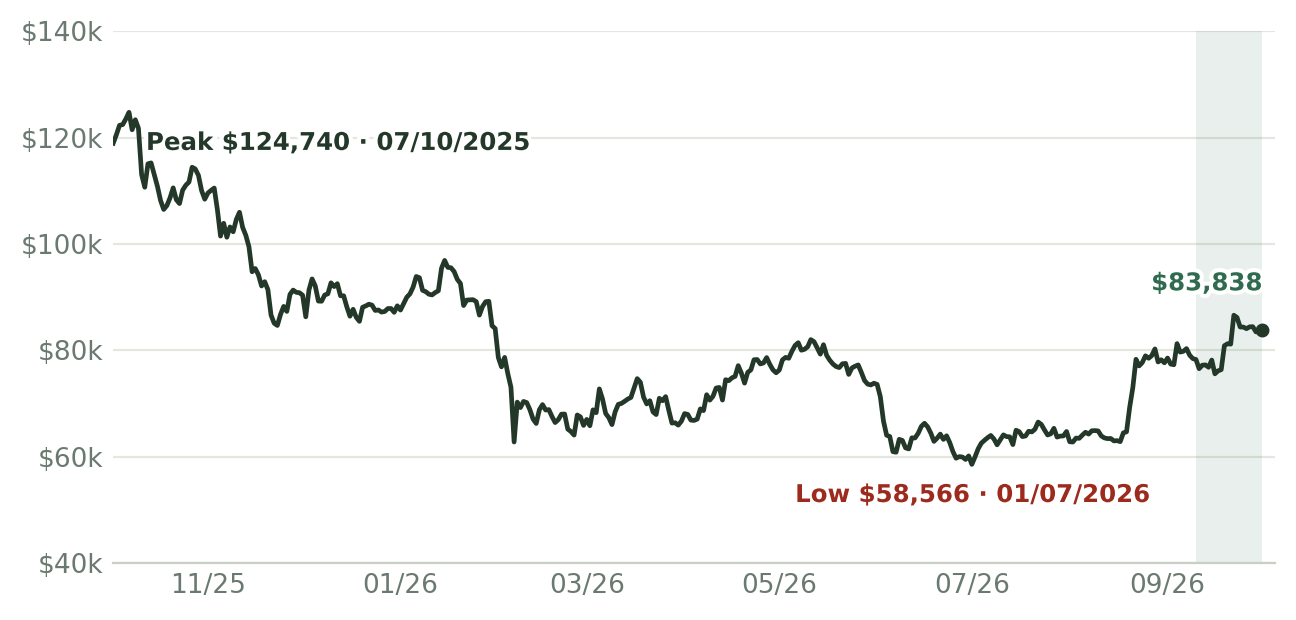
Bitcoin daily close, twelve months. The shaded area is the latest 15 sessions. Source: CoinGecko, as of 01/10/2026.
From peak to low is −53% ($124,740 on 07/10/2025 down to $58,566 on 01/07/2026). From the low to today is +43%, and from the peak to today it is still −32.8%. On 21/09 Bitcoin touched $85,000 for the first time since January, accompanied by at least $750 million of liquidated positions in 24 hours, mostly shorts. · The Block
Bitcoin ETF Flows · $ Million
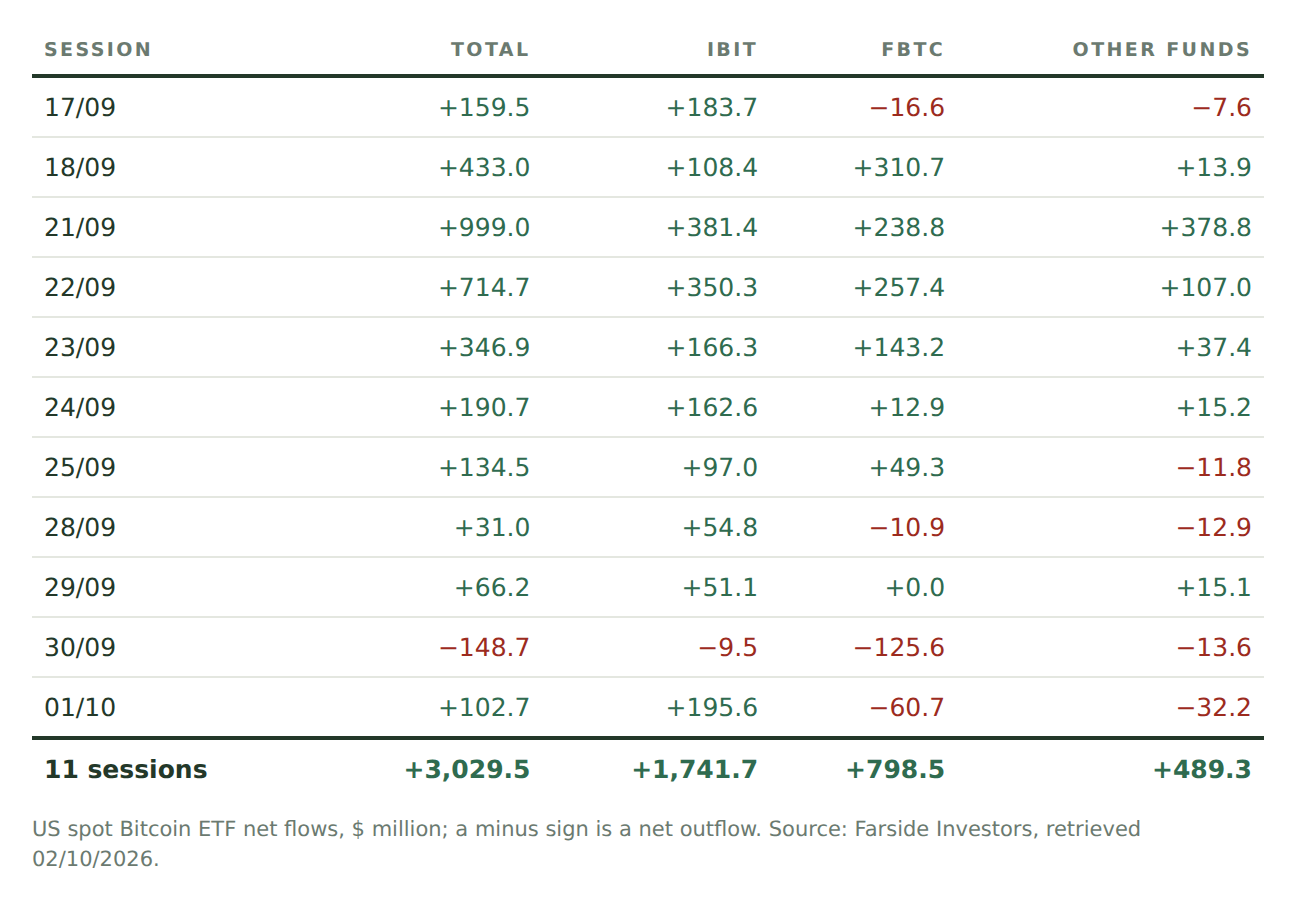
US spot Bitcoin ETF net flows, 17/09 to 01/10, $ million: +3,029.5 in total, of which IBIT +1,741.7, FBTC +798.5 and other funds +489.3. Source: Farside Investors, retrieved 02/10/2026.
Net inflows came in 10 of 11 sessions, $3.03 billion in total, right after two net-outflow sessions on 15–16/09 (−$450.4 and −$295.9 million). The longest inflow streak was 9 sessions (17/09 to 29/09, +$3.08 billion); the only net-outflow session was 30/09 (−$148.7 million). The strongest session was 21/09: $999.0 million, matching the figure The Block reported. Unlike last issue, the money did not only pile into IBIT and FBTC: those two funds add up to $2,540.2 million, while the other funds add up to $489.3 million. · The Block
Derivatives · Funding
- Bitcoin perpetual — funding 0.0056% per 8 hours · annualised +6.11% · 15-day average 0.0047%
- Ethereum perpetual — funding 0.0069% per 8 hours · annualised +7.56% · 15-day average 0.0059%
- Solana perpetual — funding −0.0047% per 8 hours · annualised −5.18% · 15-day average 0.0045%
Source: Binance Futures, at 2026-10-01 12:43 UTC. The 15-day average is the mean of the last 45 settlement periods.
Bitcoin funding of 0.0056% per 8 hours, about 6.11% annualised, is below the 0.0099% of issue A03 even though the price rose more than 7%. This rally was not pushed by buyers' leverage. Solana is the opposite case: funding is negative (−0.0047%), meaning those betting on a lower price are paying those betting on a higher price, even though Solana was the strongest of the three large coins (+16.50%).
Top Gainers and Losers · 14 Days
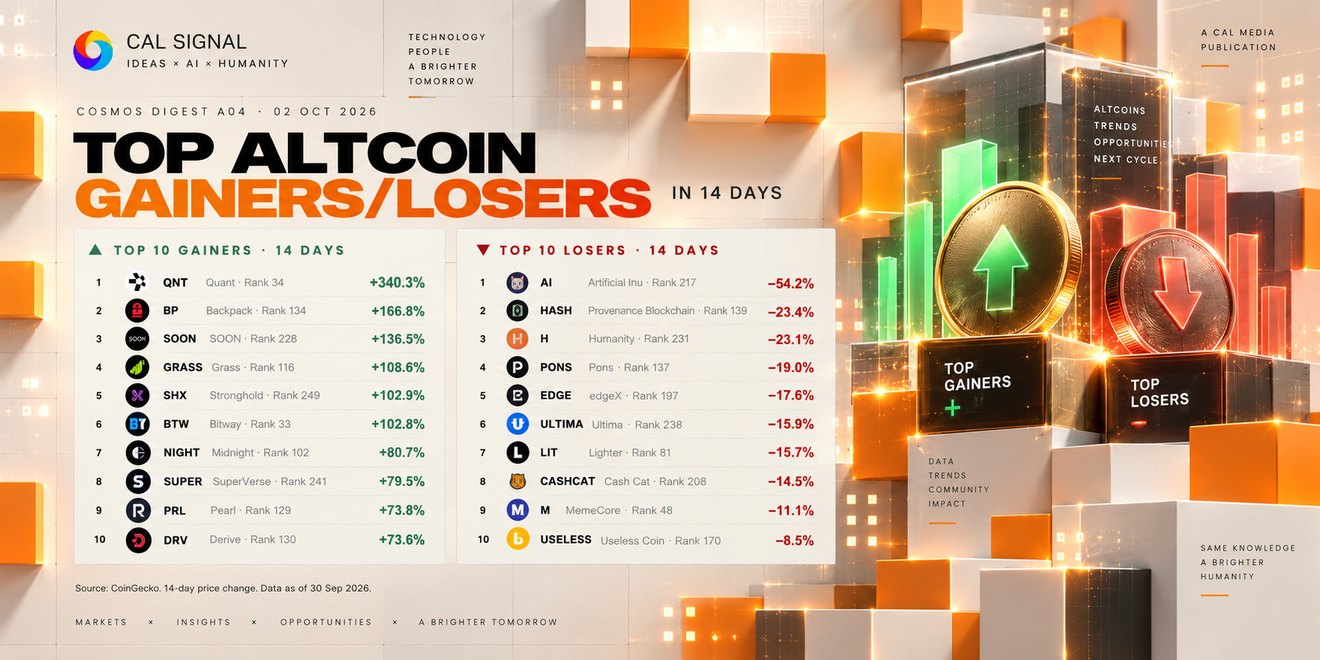
Top 10 altcoin gainers and losers over 14 days to 30/09/2026. Gainers: QNT +340.3%, BP +166.8%, SOON +136.5%. Losers: AI −54.2%, HASH −23.4%, H −23.1%. Covers the 250 largest coins by market capitalisation, with stablecoins, wrapped tokens and pegged assets removed. Some tickers have market capitalisation reported by the projects themselves. Source: CoinGecko, 01/10/2026.
At the top is QNT (Quant) at +340.3%, ranked 34th by market capitalisation. CoinMarketCap shows the same direction for Quant, Backpack and SOON, so this is not a data error from a single source.
Market Breadth
Of the 205 coins with data, 176 rose and 29 fell over 14 days (86% up); the median gain was +18.8%, against Bitcoin's +7.1%. This rally was broader than Bitcoin. Last issue Bitcoin had 59.02% of market capitalisation; this issue 58.66%. The share of every coin other than Bitcoin and Ethereum edged from 29.60% to 29.84%.
One index needs reading together with its timing. The Fear & Greed Index is at 74 (Greed) on 01/10. It is fixed once a day at 00:00 UTC, so it describes the sentiment of the previous day, not of the moment you are reading.
04 — Crypto Movements (Protocols & Exchanges)

Congress has stopped; the federal agencies keep working.
● SEC · A Five-Year Innovation Exemption
On 17/09 the SEC announced an innovation exemption: a conditional five-year exemption, effective immediately, for on-chain trading of certain tokenised equities. The order exempts "tokenised securities exchanges" from being classed as exchanges and exempts certain AMM liquidity providers from dealer rules; it excludes synthetics and requires sanctions compliance. An exchange wanting to operate must post a public notice at least 30 days before opening. Public comment is open. The same week, Hester Peirce, one of the longest-standing pro-crypto voices at the SEC, leaves the agency on 02/10. · Federal Register · CoinDesk
● CFTC and Fed · America Moves On While Congress Stops
Three days after the CLARITY Act failed a Senate procedural vote, the agencies did not wait. On 17/09 the CFTC announced a no-action position: it will not recommend enforcement against software developers for failing to register as introducing brokers. On 18/09 the CFTC sent the White House two rulemaking files on crypto-asset trading and markets. On 24/09 the Fed proposed reserve limits and capital standards for stablecoin issuers under the GENIUS Act, effective from January 2027. A no-action letter is not law: a later administration can reverse it. · The Block, 17/09 · The Block, 18/09 · The Block, 24/09
● Bitget · $387.5 Million from a Hot Wallet
At 18:31 UTC on 24/09 Bitget detected unauthorised transfers from part of its hot and warm wallet layer; the initial estimate was about $351.6 million. An update on 25/09 raised the confirmed figure to $387.5 million; the increase is Zcash and TRON from the same incident, not new transfers. Bitget said cold wallets were not affected, user balances remain fully covered, the loss is being made good by its user protection fund (5,500 BTC), and it has brought in Mandiant and SlowMist to investigate. Withdrawals reopen in phases from 28/09; the remainder, fiat and P2P, on 02/10. · Bitget, 25/09 · The Block
● Equity Perpetuals · America Opens the Door, No Product Live Yet
Coinbase, Kraken and Kalshi have each applied for perpetual contracts on single stocks in the US (leveraged, cash-settled, 24/5 trading, no expiry). On 28/09 Coinbase Clearing was approved by the CFTC as a clearing organisation for futures, options and fully collateralised swaps, but no leveraged product runs through that clearing house. Robinhood plans to open perps in the US in the coming months through Bitstamp, with a 0.01% fee to the end of the year and up to 10x leverage on BTC and ETH. All of it awaits regulators. · Finance Magnates · The Block, Coinbase · The Block, Robinhood
● Prediction Markets · States Sue, States Ban
On 18/09 Missouri Attorney General Catherine Hanaway issued cease-and-desist orders to six platforms, including Crypto.com, Polymarket and Kalshi: sports event contracts are betting and need a Missouri Gaming Commission licence. On 24/09 New York sued Polymarket, alleging an unlicensed gambling operation, and asked the court to stop its business and advertising in the state until it registers; Polymarket said it is staying in New York, where it has more than 350 employees. After Connecticut in issue A03, this is the third state in under three weeks. · Missouri AG · The Block
● WSJ · Lagarde and Binance's MiCA File
According to the Wall Street Journal via CoinDesk on 18/09, a Greek official told Binance that Christine Lagarde wanted the MiCA decision delayed until ESMA takes over crypto licensing across the EU. Lagarde and the ECB have no legal authority over this decision; the ECB, Binance and the Greek authority have not confirmed it, and Binance denies it. · CoinDesk
● Corporate Treasuries · Four Names This Period
- Strategy — bought 1,665 BTC (21–27/09), about $142.7 million, average price $85,681 · total 847,666 BTC · average cost $75,437 · The Block
- Bitmine — bought 17,362 ETH from 21/09 · total 6,001,302 ETH · 5,067,309 staked · The Block
- Strive — bought 1,355 BTC (14–18/09), about $107.7 million · total 26,355 BTC · The Block
- Riot — repaid its $200 million Coinbase Credit facility in full (21/09) · released about 5,821 BTC from collateral · CryptoBriefing
● WaterPlum · 30,000 Machines, More Than 7,000 Wallets
On 18/09 Japan's National Police Agency and the FBI announced that the WaterPlum group, linked to North Korea, infected more than 30,000 devices in over 100 countries between 12/2025 and 07/2026 through a fake-recruitment ploy (Contagious Interview), and took information on more than 7,000 wallets; about ¥1.7 billion (≈ $10.71 million) was moved toward North Korea. The $10.71 million is the money flow observed, not the total loss. · NPA Japan, PDF
05 — Market Trends (Four Scenarios to Q3 2027)
Four Scenarios · Fable, Chief Strategy Officer
The FOMC switch from issue A03 now has an answer. On 16/09 the Fed raised 25 basis points to 3.75–4.00%, by a vote of 12–0: the "If the Fed HIKES" branch was triggered, and the A03 weights moved to K1 30 · K2 35 · K3 20 · K4 15. The contrarian view of Cosmos Digital's founder, Alex, in the previous issue (that the Fed would not hike) did not come to pass; the newsletter records it exactly as promised. But sixteen days after the meeting, one number has just changed the direction of the whole debate: the September jobs report.
The Number That Tipped the Scale
On 02/10 the US Bureau of Labor Statistics reported that September non-farm payrolls rose only 29,000, against an average of 45,000 a month over the previous 12 months; unemployment is 4.2%. July was revised from +21,000 to −10,000 and August from +162,000 to +133,000: the two months together are more than 60,000 lower than first published. Hourly earnings rose 0.1% in the month, 3.0% year on year. · BLS, Employment Situation, September 2026
Rates markets reacted within hours. On Polymarket the probability of a Fed hike on 28/10 fell from 24.5% (09:43 UTC) to 16.5% (13:19 UTC); the CME FedWatch tool shows something similar, about 17%, according to the day's market reports. The 10-year yield pulled back from its 30/09 peak of 5.29% to around 5.18% during the session, the 2-year to 4.73% and the 30-year to 5.57% (secondary sources; the FRED series for 02/10 is not yet final). · IndexBox · Babypips
Two Markets, Two Answers · and a Third
Through 30/09 the bond market was reading K3. The 10-year yield at 5.29% (the highest since 05/2002), the 30-year at 5.64%, and core PCE at 3.01% has not turned: three readings in a row sideways around 3.0% (3.04% · 2.98% · 3.01%). The crypto market was reading K1. Bitcoin at $83,838, +7.10% in 15 sessions; the 15-session high of $86,597 (22/09) slightly exceeded the upper edge of the $86k ceiling band and then retreated. Bitcoin ETFs saw net inflows in 10 of 11 sessions, +$3.03 billion; funding of 0.0056% per 8 hours means buyers' leverage has not led the rally.
The jobs report gives a third answer: the Fed will find it hard to hike again because of employment, but with inflation still above 3% it will also find it hard to cut. That is not pure K1. It is K2 with a K1 door ajar.
Four Scenarios · Measured from $83,838 · to Q3 2027
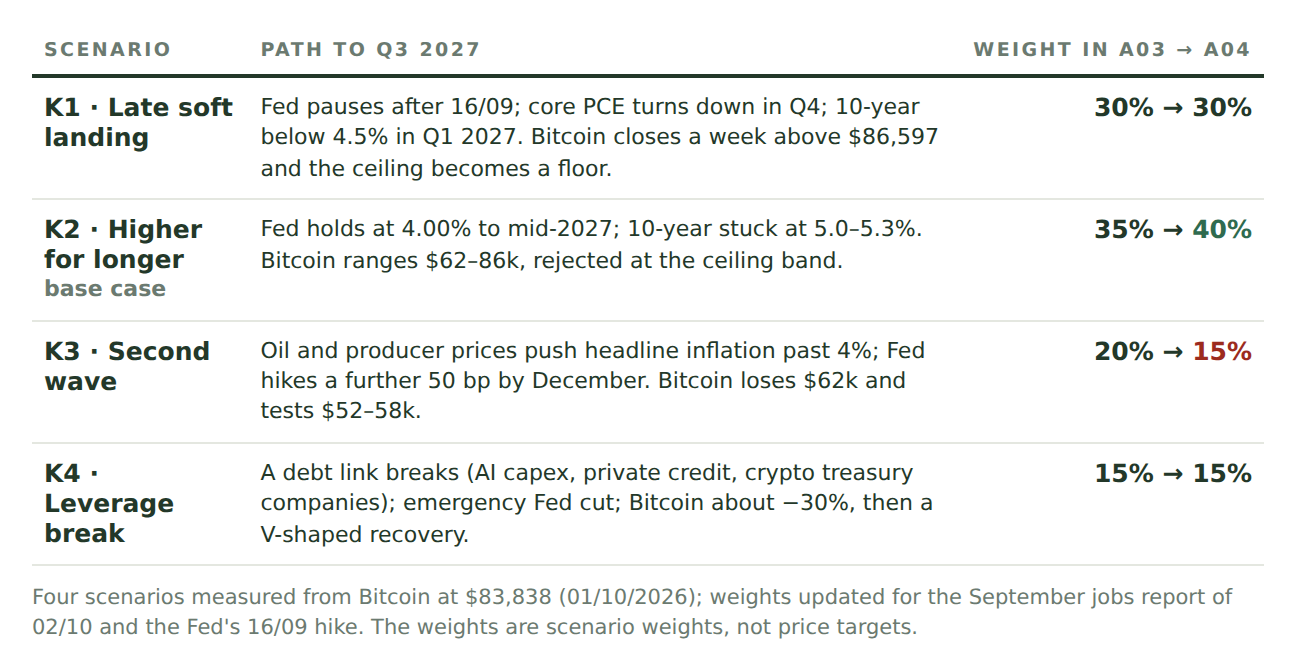
The four scenarios to Q3 2027, with weights in issue A03 and in this issue: K1 30% → 30%, K2 35% → 40%, K3 20% → 15%, K4 15% → 15%.
- K1 · Late soft landing — 30% (unchanged). The Fed pauses after 16/09, core PCE turns down in Q4, the 10-year falls below 4.5% in Q1 2027. Bitcoin closes a week above $86,597 and holds, so the ceiling band becomes the new floor; altcoins recover selectively. Weak employment plus ETF inflows of $3.03 billion keep K1 at 30; core PCE at 3.01% stops it going higher.
- K2 · Higher for longer — 40% (from 35), the base case. The Fed stands at 4.00% until mid-2027: no hike because of employment, no cut because of inflation; the 10-year stuck in a 5.0–5.3% range. Bitcoin ranges between $62k and $86k, rejected at the ceiling band; ETF flows reverse with the news; Bitcoin keeps a high share, altcoins stay weak. The jobs report fits the K2 picture: the economy is cooling just enough for the Fed to stand still, not enough for it to cut.
- K3 · Second wave — 15% (from 20). Oil and producer prices push headline inflation past 4%; the Fed hikes a total of 50 basis points by December; the 10-year holds above 5.2% throughout Q4. Bitcoin loses the $62k floor and tests $52–58k; recovery comes late, at the end of 2027. Lowered because a second hike in October has been almost ruled out by the market; this branch only revives if September CPI (14/10) comes in hot.
- K4 · Leverage break — 15% (unchanged). Rates standing high for long enough break a link in the debt chain (AI capital spending, private credit, crypto treasury companies); the Fed cuts in an emergency; Bitcoin falls about 30% and then recovers in a V. Weak jobs do not make K4 heavier: K4 depends on the structure of debt, not on one report. Its fuse (the high-yield credit spread) has no verified figure this issue, so it is not written up.
FOMC Switch · to Use After 27–28/10
- If the Fed HOLDS and the statement says "monitor further" (the scenario the market is pricing at about 83%): K1 30 · K2 45 · K3 10 · K4 15.
- If the Fed HOLDS but signals December (a dissent calling for a hike, or a statement stressing inflation): K1 25 · K2 40 · K3 20 · K4 15.
- If the Fed still HIKES 25 basis points (to 4.00–4.25%): K1 10 · K2 30 · K3 45 · K4 15. A hike after a +29,000 jobs report is the definition of K3.
Two milestones before the meeting: the FOMC minutes on 07/10 (what members say about long yields and employment) and September CPI on 14/10 (whether core stays below 2.5% or jumps).
What the Market Is Pricing · FOMC 27–28/10
- Hold rates — 74.5% before the report (09:43 UTC) · 83.5% after (13:19 UTC)
- Hike 25 points — 24.5% · 16.5%
- Hike 50 points or more — 0.45% · 0.45%
- Cut 25 points — 0.55% · 0.55%
- Cut 50 points or more — 0.25% · 0.25%
Source: Polymarket, 02/10/2026. The jobs report was published at 12:30 UTC. The columns add up to slightly more than 100% because of rounding.
Bitcoin Between Two Structural Bands
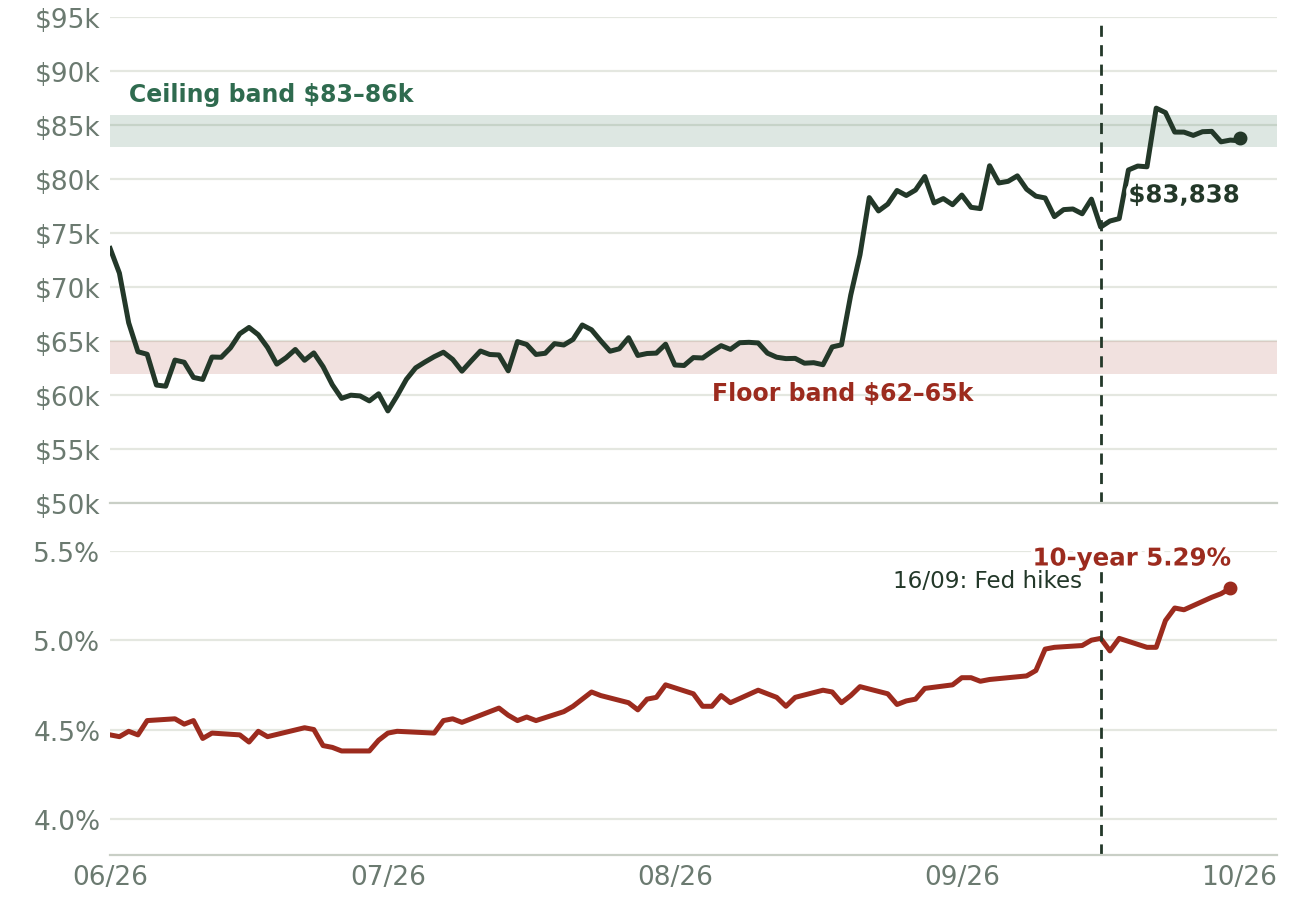
Upper panel: Bitcoin daily close since 01/06/2026 with the two bands. Lower panel: US 10-year yield on the same time axis. Sources: CoinGecko, FRED.
The A03 bands stay unchanged: ceiling $83–86k, floor $62–65k. Bitcoin at $83,838 sits inside the ceiling band; the 15-session high of $86,597 slightly exceeded the upper edge and then pulled back. The two bands are structural zones defined by Cosmos Digital, not price targets. A weekly close is needed to arbitrate: above $86,597, K1 takes the lead; back below $83k while the 10-year is still above 5.0%, K2 holds the upper hand; losing $62k is K3. Bitcoin on Binance at 02/10 is around $85,312; the newsletter keeps the 01/10 closing price for all the data.
What Issue A03 Promised to Track · The Answers
- The 2-year yield against the Fed ceiling. 4.88 minus 4.00 = 88 basis points on 30/09, against 92 in A03: narrower by 4 points while the ceiling has risen 25 points. Too little to call a K1 signal. After the jobs report the gap narrowed further (2-year around 4.73% in the 02/10 session); the final figure awaits FRED and will be printed in A05.
- ETF flows after the FOMC. The net-outflow streak of 08–11/09 did not resume; net inflows in 10 of 11 sessions, +$3.03 billion, the only outflow on 30/09 (−$148.7 million). The answer leans to K1 on the price axis.
- The SEP dot plot, foreign capital into Vietnam after 21/09, the high-yield spread: no verified figure this period, so they move to A05 rather than being guessed. Foreign flows into Vietnam, on their own, are already in section 01.
- New to track. For A05 (16/10): the FOMC minutes of 07/10, September CPI on 14/10, and whether Bitcoin gets a weekly close above $86,597. For A06 (02/11), after the FOMC: whether the 10-year holds above 5.0% through 28/10, and whether September core PCE falls below 3.0%. The October jobs report (06/11) will be in A07: whether this weak run is a trend or calendar noise.
— Fable, Chief Strategy Officer, Cosmos Digital
06 — One Token Each Issue (Profile: ICP)
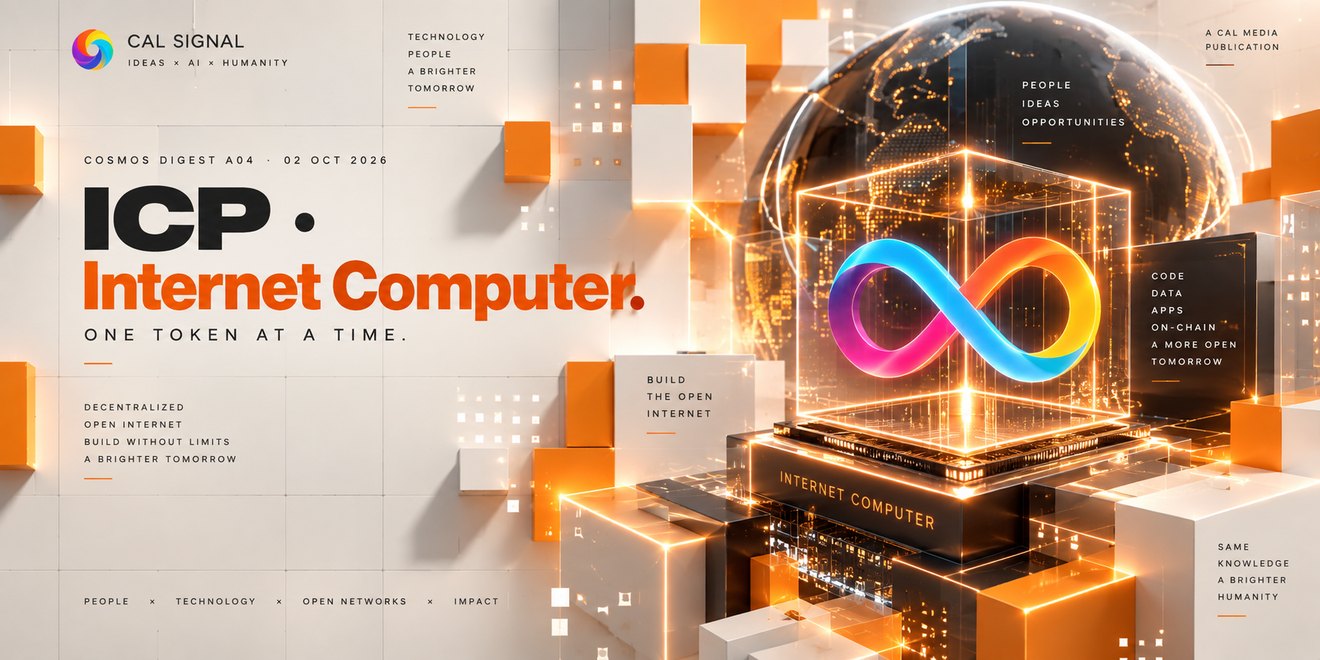
ICP. The utility token of the Internet Computer: used for voting, converted into cycles, and paid to node operators. Price $3.26, ranked 58th by market capitalisation.
What It Is and How It Works
ICP is the token of the Internet Computer. Holders can lock ICP into a neuron in the Network Nervous System to vote and earn voting rewards. ICP is burned to mint cycles through the Cycles Minting Canister; cycles pay for computation. The documentation states that 1 trillion cycles equals 1 XDR, so an application developer's costs track a basket of currencies rather than the ICP price. Node operators are paid in newly minted ICP. · ICP documentation
How It Came About
In summer 2015 there was a website with the goal of a blockchain that could do the work of the internet cloud. In October 2016 the DFINITY Foundation was set up in Zug, later moving to Zürich. In February 2017 a public sale sold 25% of the tokens at 3 cents each. In 2018–2019 there were two private funding rounds; the summer 2018 round raised $102 million led by a16z crypto and Polychain (CoinDesk), after a $61 million round in February. The official history page says this round sold ICP at about $5 a token, at a diluted valuation of around $2 billion. The network launched on 10/05/2021; the Caffeine beta opened to the public on 15/10/2025 at caffeine.ai. · internetcomputer.org · CoinDesk 29/08/2018
The Team and Foundation Behind It
The legal entity is the DFINITY Foundation, set up in October 2016 in Zug. The founder is Dominic Williams, who is also Chief Scientist. The 2018 funding round was led by a16z crypto and Polychain. · Paris Blockchain Week
Finances · Supply and Price
- Price — $3.26 · −4.0% over 24 hours
- Market capitalisation — $1.82 billion · rank 58
- 14 days — +24.8% · 30 days +31.4%
- 12 months — −25.6% · 7 days +4.6%
- All-time high — $700.65 · 10/05/2021 · −99.5%
- All-time low — $2.00 · 01/08/2026
- Circulating supply — 557.0 million · total 557.0 million
- Public sale — $0.03 · 02/2017 · 25% of tokens
Source: CoinGecko, 01/10/2026.
Today's price is 99.5% below the peak, 35% below the summer 2018 funding-round price (about $5), but 63% above the 01/08/2026 low. Over 14 days the price rose 24.8%, more than Bitcoin (+7.10% in 15 sessions) but not enough to enter the period's top-10 gainers.
On-Chain · Infrastructure
Two native assets: ICP and cycles. Cycles are pegged to XDR, so the cost of running an application does not move with the ICP price. New issuance has two sources: voting rewards for those who lock ICP, and rewards for node operators. According to Dominic Williams's Mission 70 paper (v1.1.1, 06/02/2026), newly minted ICP was 9.72% a year in 01/2026 (voting rewards 5.88%, node rewards 3.84%), with a target of reducing it to 5.42% in 01/2027. The method: cut the maximum lock time from 8 years to 2 years, cut node rewards for generation-1 nodes by 40%, and increase ICP burning when cycles are used. The NNS community approved the package on 07/04/2026. · Mission 70 · TradingView/CoinMarketCal
Why It Rose This Period
No single story explains the 30-day gain. CoinMarketCap's automated summary of 30/09 lists the network recording about 138.9 million transactions in 24 hours, short liquidations, and capital rotating into the infrastructure group, but that is a machine-generated summary line, not primary data. The newsletter repeats it so readers know, and does not use it as an explanation. · CoinMarketCap
Three Things to Weigh
One: supply is both being minted (node rewards, voting rewards) and burned (cycles, fees), and CoinGecko records no maximum supply; Mission 70's deflation target depends on burning rising more than tenfold through real users. Two: the 3-cent price of the 2017 sale and the roughly $5 of 2018 are sale prices, not market prices. Three: the 30-day gain starts from near the all-time low, so a large percentage does not mean a long recovery.
07 — Story of the Issue (Analysis)
5.29%. The 10-year US Treasury yield on 30/09, the highest in the FRED series since 14/05/2002 and higher than the 5.26% peak of 12/06/2007, fifteen months before Lehman Brothers collapsed. Fourteen days earlier, the Fed had just raised rates for the first time since 2023. · FRED DGS10
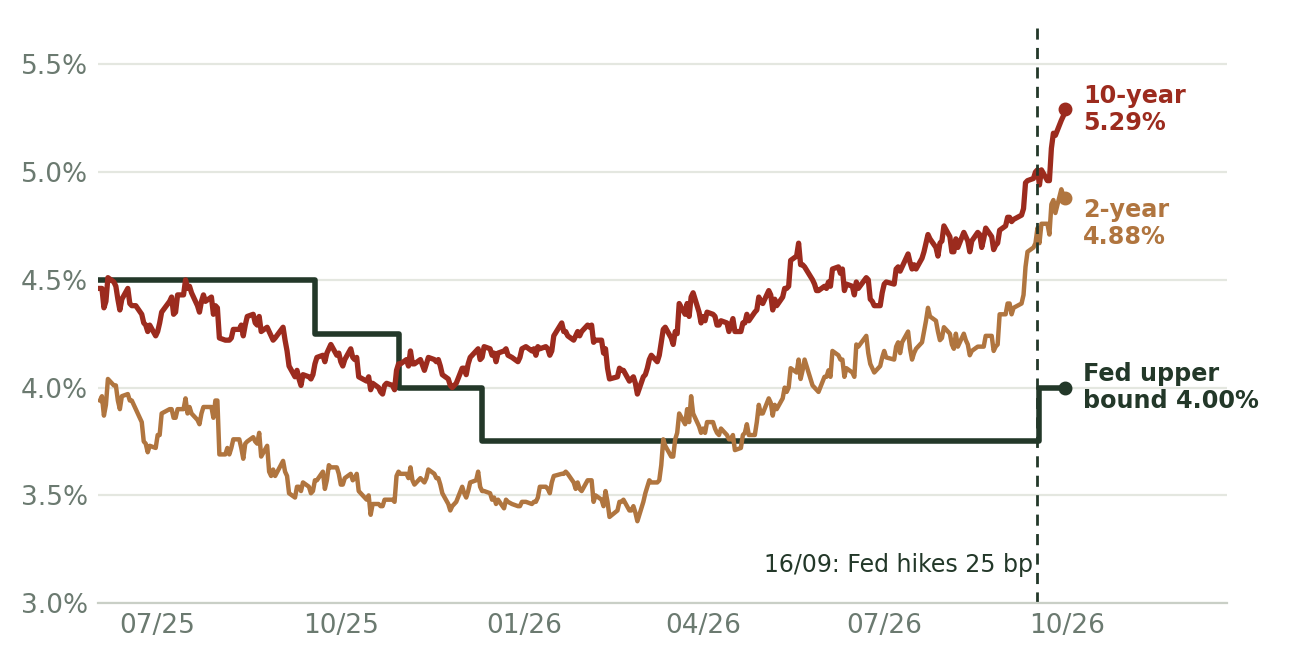
Top: the 10-year yield, 5.29%. Below it: the 2-year yield, 4.88%, and the Fed's upper bound, 4.00%. Source: FRED, as of 30/09/2026.
Mechanism · How Interest Rates Become Systemic Risk
High rates do not cause a crisis by themselves; they expose who borrowed short to hold long assets. There are three channels this period. One, bond prices: the books of banks, insurers and pension funds hold bonds bought at much lower yields. A 30-year yield of 5.64% on 30/09 means the unrealised loss on those books is widening, the very mechanism that brought down Silicon Valley Bank in March 2023. Two, refinancing: companies and commercial real estate with debt maturing from the low-rate era have to borrow again at the new level; the shock does not arrive on the day the Fed hikes, but on the day the old contract expires. Three, cross-border yield gaps: the same week the Fed raised to 3.75–4.00%, the Bank of Japan took its overnight rate to around 1.25%. The carry trade of borrowing yen to buy dollar assets is squeezed from both ends, and August 2024 showed how fast an unwinding carry trade spreads into equities and crypto. · FOMC 16/09
What the Gap Between 4.00 and 5.29 Says
The Fed's ceiling is 4.00% (effective 17/09); the 10-year yield is 5.29%; the difference is 1.29 percentage points (5.29 minus 4.00). When long yields sit this far above the policy rate after a round of hikes, the bond market is demanding a premium for what the Fed does not control: the supply of government bonds and persistent inflation. The 2-year yield of 4.88% is exactly one percentage point above the effective rate of 3.88% (the DFF series, 30/09; 4.88 minus 3.88 is 1.00). The market is pricing the chance of the Fed hiking again, not of the Fed turning back. The most notable thing is the speed: the 10-year yield went from 5.01% (18/09) to 5.29% (30/09), 28 basis points in eight trading days. The risk in rate-driven crises is seldom in the level of rates but in the pace of change, because balance sheets cannot hedge in time. · FRED DFEDTARU
Which Bells Have Rung, Which Have Not
Rung: the level of long yields (10-year at the highest since 2002, 30-year at 5.64%); the policy rate turning to a hike by a 12–0 vote; Japan hiking the same week. These are price bells. Not yet rung, or not yet measurable: liquidity bells. This period we have no verified data on the spread of corporate bond yields over government bonds, on banks' credit default swap premiums, or on the Fed having to open an emergency lending window, so this piece reaches no conclusion on those three. The difference between a bell and a crisis lies exactly here: a bell is when asset prices change; a crisis is when a short-term funding market stops matching orders and someone cannot roll overnight debt. In 2007 the 10-year yield peaked at 5.26% in June; the interbank lending market froze only in August. Prices changed first, liquidity broke later, and not every time prices change does it lead to a break.
The Counter-Argument
The opposite argument also stands. High yields may mean the US economy has not broken: the Fed hiked because growth and employment can bear it, not because of panic. America's big banks face annual Fed stress tests, and the Fed's emergency lending facilities have a template from earlier crises. The comparison with 2007 holds on only one number: then the risk sat in packaged subprime mortgages, now it sits more in government debt and duration, two things that unfold more slowly and more publicly. A rise in yields driven by real growth is an environment that equities and risk assets have passed through many times. The question is not "are high rates dangerous" but "why are they high": because of growth, or because bond buyers are walking away.
Cosmos View · Confirmation Conditions Before the FOMC of 27–28/10
The warning stands if at least two of the following four are confirmed with primary data before 27/10: (1) the 10-year yield holds above 5.29% or sets a new high while the 30-year yield remains higher, meaning the market is demanding a term premium and not only pricing the Fed; (2) US Treasury auctions of 10- and 30-year bonds in October clear at yields higher than the market yield at the close of bidding (TreasuryDirect publishes each auction); (3) the Fed's H.4.1 report shows banks beginning to use the discount window or the standing repo facility; (4) Japanese government bond yields and the yen exchange rate move sharply after the BoJ decision, a sign that the carry trade is unwinding. The warning is rejected if the 2-year yield falls back while the 10-year stays still and auctions are absorbed well: that is the market moving from fearing inflation to fearing growth, a different story with a different set of indicators. These are conditions to watch, not advice to buy or sell.
— Fable, Chief Strategy Officer, Cosmos Digital
08 — The Cosmos Ecosystem (Interview)

At the end of September the hot wallet of Cosmos Digital (CDI) had NFTs and WPOL drained. According to CDI, the cause did not lie in the wallet itself. Founder Alex Pham tells the sequence of events, the response and the lessons, in his own words.
Public context. On 25/09, reports disclosed a vulnerability in Limit Break's Payment Processor V2, a contract Magic Eden used for payments on its EVM NFT marketplace between about 02/2024 and 10/2024. The Block quotes Yuga Labs: a whitehat operation rescued 23,155 NFTs worth more than $5.7 million, while 660 WETH could not be recovered. Magic Eden said it stopped using the contract in 10/2024 and no active listings are affected. Users were advised to revoke approvals granted on Ethereum, Polygon and Base. · The Block · Egamers
What CDI's Hot Wallet Is Used For, on Which Networks, and Was This the Wallet That Was Attacked?
Cosmos Digest: What is CDI's hot wallet used for, on which networks, and is this the wallet that was attacked?
Alex: CDI has hot wallets on EVM and Solana, used for trading and internal transfers. This is the wallet that was attacked.
How CDI Found Out
Cosmos Digest: How did CDI know something was wrong?
Alex: CDI receives alerts from abnormal transactions on the hot wallet, sent to Telegram. All of CDI's wallets are monitored 24/7; every transaction is reported to Telegram in real time.
What Was Lost, and How Far the Risk Spread
Cosmos Digest: What was lost, and how far did the risk spread?
Alex: After reviewing, CDI found that NFTs and WPOL had been drained. The risk spread to almost all NFTs and assets on four networks: Polygon, Base, Ethereum and Arbitrum.
How CDI Responded, and What the Real Cause Was
Cosmos Digest: How did CDI respond, and what was the real cause?
Alex: CDI activated its emergency procedure. The first step was to establish that the withdrawals were abnormal and did not originate from internal transactions. Then we traced the cause, identified which vulnerability was being exploited and scoped the extent of the impact.
Alex: The result showed this was a third-party security vulnerability. The contracts that the hot wallet had signed on the Magic Eden NFT marketplace earlier, which allowed the marketplace to withdraw NFTs and coins to carry out listings and deposits, had been exploited. The hacker triggered those contracts and forced CDI's hot wallet to sell NFTs at almost $0 to seize them. Using the same trick, the hacker triggered forced buy orders for worthless NFTs, thereby draining the assets used as deposits.
Alex: This is a "supply chain" risk that comes from a third party, not a flaw in the hot wallet. CDI's hot wallet remained secure, but the scope of impact was very wide. We quickly revoked all the contracts the hot wallet had signed on Magic Eden to stop the hacker withdrawing more. Fortunately, most of the assets remained safe.
What the Incident Says About Security Risk
Cosmos Digest: What does this incident say about security risk?
Alex: Security does not stop at managing internal risk; it also involves partners and the whole industry. However good your internal processes are, if your partner or supplier has a vulnerability, the risk is almost unavoidable. To trade you have to connect, and once you connect you carry the risk. Without connecting there is no risk, but you can't do anything either.
What Alex Wants to Tell Readers
Cosmos Digest: What would you like to say to readers?
Alex: In the investigation that followed, we found that more than 10 million USDT of assets had been taken by hackers. The security community also quickly started whitehat operations: exploiting the very same vulnerability to pull millions of dollars of assets into safe wallets and then return them to their owners. But once the vulnerability was found, many other hackers exploited it quickly too. It was almost a race between hackers and whitehats to seize and recover assets.
Alex: I hope this event is a warning: do not trust partners and third parties too much. Revoke all the contracts you have signed if you do not use them regularly. A contract that is safe today is not certain to be safe in the future. Spread your assets across multiple chains and multiple wallets: beyond the risk of a leaked private key, the risk of transacting on-chain often comes from only a few chains or a few fixed assets.
Alex: Finally, build an alert system that watches for abnormal withdrawals. Recognising risk early helps isolate the scope and limit the damage.
— Founder Alex Pham

09 — Next Issue's Calendar (Events)
Macro · Vietnam Time
- 02/10 · 19:30 — The US jobs report for September. · BLS
- 08/10 · 01:00 — Minutes of the 15–16/09 FOMC meeting (published at 14:00 Eastern on 07/10), the first reading of the words of the meeting that raised rates. · Fed
- 14/10 · 19:30 — September CPI (US), the same day as the Beige Book; PPI on 15/10. · BLS
- 28–29/10 — The FOMC meets 27–28/10, press conference at 14:30 Eastern on 28/10 (01:30 on 29/10 Vietnam time). · Fed
Markets
- 02/10 — Hester Peirce leaves the SEC; Bitget reopens the remaining assets, fiat and P2P. · CoinDesk · The Block
- 06/10 — Glamsterdam goes live on the Sepolia testnet; the Q4/2026 mainnet date is not fixed. · Parameter
- 13/10 — Kalshi ends its Volume Incentive Program, no earlier than this date. · The Block
- 19/10 — Upbit and Bithumb delist ICX; the ICX/KRW pair closes from 15:00 Korean time, withdrawals open until 18/11. · PANews
- 28/10 — Strategy shareholder meeting on daily dividends for its four preferred stocks. · The Block
From Cosmos
- 03/10 — CAL Signal issue B06, the English-language AI technology newsletter, published every Saturday.
- Next issue — A05, published on 16/10/2026.